
Improve Your Graphics Part 3
In the last post, we offered suggestions to improve upon Microsoft’s default settings. This post is for our readers who may not know how those changes were made.
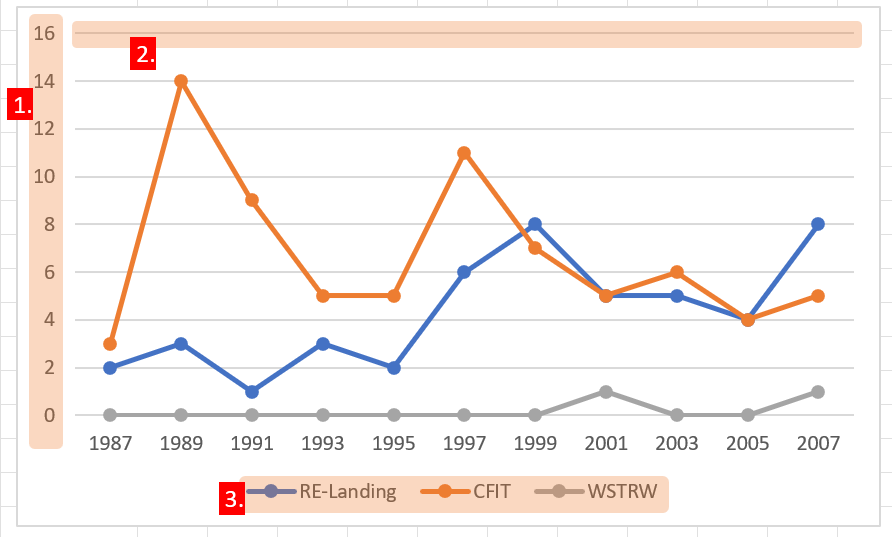
The default settings in this example, a line graph, contain some elements that work against rapid transfer of information. Remember: graphics, charts, and tables are all about the data.
The title area is unneeded unless you do not plan to include the title in the document as a figure title.
The scale on the left slows down data transfer by forcing the viewer to look back and forth from the lines to the scale, and then back to the next line, to know the value.
The lines running horizontally from the scale clutter the data area of the chart.
The key at the bottom also forces the viewer to look up from it to the line and back again.

When using line graphs, it is helpful to use Line with Markers. This provides firm data points.

Now, we start to remove the chartjunk —this is any ink/pixel, symbol, area of color, cute image, or anything not needed to transfer information.
Start with the Chart Title. Right-click on it and delete.

Repeat the process (right click → delete) on the: 1. side scale, 2. scale lines, and 3. legend/key.
We are left with the essentials.

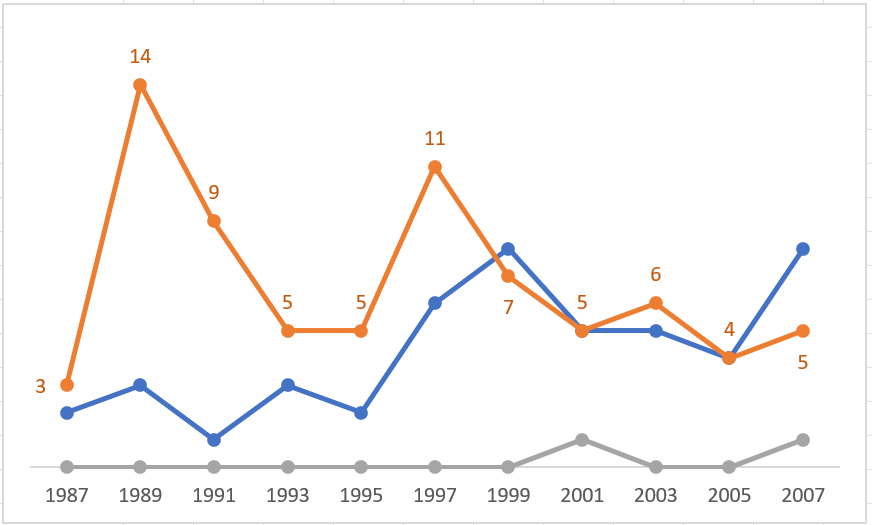
Now, we add the labels that take the place of the scales and key.
Right-click on one of the markers on the orange line, then Add Data Labels.

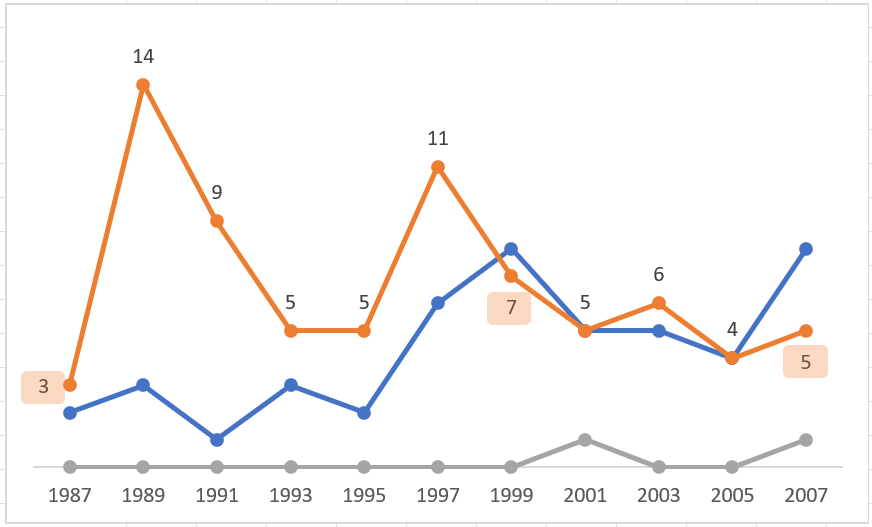
All the makers now have their data value.

The default placement will sometimes introduce confusion. When using multiple lines, it is helpful to separate the numbers of the different lines; in this case, we will move all the numbers for the top line above the data points.
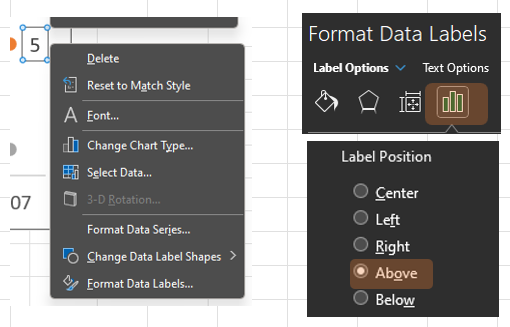
Right-click on one of the numbers, then Format Data Labels.
Format Data Labels (the menu on the right of the screen) →Text Options → Above.
Note that even with this change, the 3, 7, and last 5 could still cause confusion.

Click on the 3 and then click a second time.

The small blue dots at the box’s corners are now larger white dots. You will see that the other labels are deselected.
Right-click on the 3 → Format Data Labels (the menu on the right of the screen) → Text Options → Left.
The 3 is now placed to the left of the maker.

Repeat on the 7 (move below), and that last 5 (move below).
To further solidify the link between the line, dots, and labels (numbers), select the labels → right-click → Format Data Labels → Text Options → Text Fill → Solid Fill, then choose a color that matches the line.
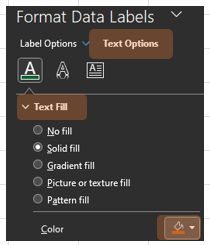
Repeat this for the remaining lines.

Note that we omitted the zeros from the bottom line. Any placement of the numbers would add confusion and, because the dots are on the zero line, the numbers would be redundant.
Finish the lines by inserting text boxes with each line’s name. Adjust the text boxes’ placement to clearly mark each line.

Now the chart can be copied and pasted into your destination document. Remember: when copying a chart that contains text boxes, after selecting the chart by left-clicking on the edge, hold down the Shift key as you select each text box, then right-click and copy.
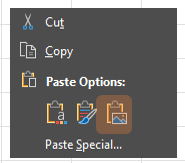
To keep the text boxes in the locations you selected inside the chart, in the destination document paste the chart as an image.
We have improved upon the Microsoft defaults and helped the viewer to quickly understand the chart.
Tune in soon to see how we can improve its aesthetic appeal!
Back to Stet Happens: All Things Editorial home.
Do you have questions or concerns about editorial matters? Share them with us!
PAI Consulting | Helping you succeed. Learn more.
Any opinions expressed in this article are those of the author and not the opinion of PAI Consulting. In addition, this article may contain links to third-party websites. PAI Consulting does not endorse or make any representations about them, or any information, software, or other products or materials found there, or any results that may be obtained from using them.
We welcome thoughtful and respectful discussion.
To keep this space safe and productive, please follow these guidelines:
Be respectful. Personal attacks, name-calling, and abusive language will not be tolerated.
Stay on topic. Keep comments relevant to the content of the post.
No spam or self-promotion. Links and promotions that are not relevant to the discussion will be removed.
Use appropriate language. This is a professional environment—please avoid profanity or offensive language.
Protect privacy. Don’t share personal information—yours or anyone else’s.
You may reply to, like, or flag other comments.
Comments are moderated and may be edited or removed at our discretion.
By commenting, you agree to abide by this policy.